The Study on Ordination as a Tool to Characterize Soil Particle Size Distribution, Applied to AN Elevation Gradient at the North Slope of the Middle Kunlun Mountains Made Progress
2011-05-04
Soil particle-size distribution (PSD) is one of the most fundamental physical attributes of soil due to its strong influence on other soil properties related to water movement, productivity, and soil erosion. Characterizing variation of PSD in soils is an important issue in environmental research. Using ordination methods to characterize particle size distributions (PSDs) on a small-scale is very limited
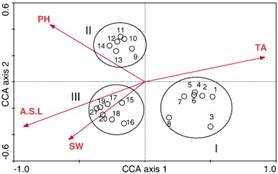
Dr. Dongwei GUI, Xinjiang Institute of Ecology and Geography, Chinese Academy of Sciences, selected the Cele River Basin on the north slope of the middle Kunlun Mountains as a study area and investigated vegetation and soil conditions from 1,960 to 4,070 m a.s.l. Soil particle-size distributions obtained by laser diffractometry were used as a source data matrix. The Canonical Correspondence Analysis (CCA) ordination was applied to analyze the variation characteristics of PSDs and the relationships between PSDs and environmental factors.
He found that a differentiation of 16 particle fractions can sufficiently characterize the PSDs in CCA biplots. Elevation has the greatest effect on PSDs: the soil fine fractions increase gradually with increasing elevation. In addition, soil pH, water and total salt content are significantly correlated with PSDs. CCA ordination biplots show that soil and vegetation patterns correspond with one another, indicating a tight link between soil PSDs and plant communities on a small scale in arid regions. The results of fractal dimensions analysis were rather similar to CCA ordination results, but they yielded less detailed information about PSDs. The study shows that ordination methods can be beneficially used in research into PSDs and, combined with fractal measures, can provide comprehensive information about PSDs.
The result was published in the Geoderma, 2010, 158 (3-4): 352-358. doi: doi:10.1016/j.geoderma.2010.06.002.

Figure 3 CCA two-dimensional ordination diagram of the first two axes showing the distribution of 21 plots and environmental variables


